
5 tips for telling newsworthy features from public data
Journalism is all about getting to the crux of an issue and showing readers why they should care. But in the same way interviews humanize a story, data allows us to zoom out and show just how large a problem is, how many people it impacts, and put everyday issues into perspective.
Sometimes, a data source contextualizes what’s happening in the world, but data itself can also power a news story. That doesn’t mean that every data source is apt for news coverage, but with the right processes and techniques, reporters can often uncover trends or insights from otherwise ordinary-appearing datasets.
Differentiating the good data from the bad is also key to providing accurate coverage that avoids assumptions. Luckily, there’s a wealth of public datasets that are free to use. Most people know about the Census Bureau’s population estimates, but it also collects data on kitchen-table topics like commuting, new construction, small businesses, economic security, and so much more.
At Stacker, we sift through thousands of datasets, academic studies, and surveys to produce hundreds of stories for readers across the country, and even Canada. To highlight some best practices when producing data journalism, here are five ways Stacker uses public data to tell newsworthy features that readers will care about:
- Make it timely
There’s a reason it’s called news. The first step to engaging readers is with new information and the latest developments in a current event.
Sometimes what the data shows is the news peg, and sometimes the news peg is a data release – though it’s important to note collecting, analyzing, and weighting so much information takes time. “New” data could be from a year before, or sometimes longer. For example, the long-term effects of COVID-19 are just coming to light today.
Historical data can provide evergreen analysis of a current event. On the flip side, if there’s an interesting dataset, such as school enrollment, potential legislation or recent studies can make the story relevant.
In any case, these stories should make clear to the reader why a certain issue matters at that moment and how it is affecting their daily lives.
- Find the right dataset and think critically
Knowing where to look is half the battle when it comes to getting data, while the other half is vetting it to make sure it's a credible source.
For those starting out, Census Stats for Stories and EIA’s Today in Energy are good public resources. But remember, part of a data journalist’s job is to discover new data and interesting ways to use it.
Explore a topic—from climate change to affordable housing—and see what’s out there. Data doesn’t always have to be directly related to the exact angle, and it can also serve a more supplementary purpose or quantify a specific aspect of a story.
However, even datasets with robust methodologies will still have caveats. As the old saying goes: If your mother tells you she loves you, check it out.
To gain trust with readers, note limitations and be upfront about what the data doesn’t tell or include. Knowing when to walk away is also important. There’s not always a story in every dataset, and sometimes it’s best to rethink the original angle.
- Translate the data into reader-friendly terms
Interpret the data and put it in terms readers can understand.
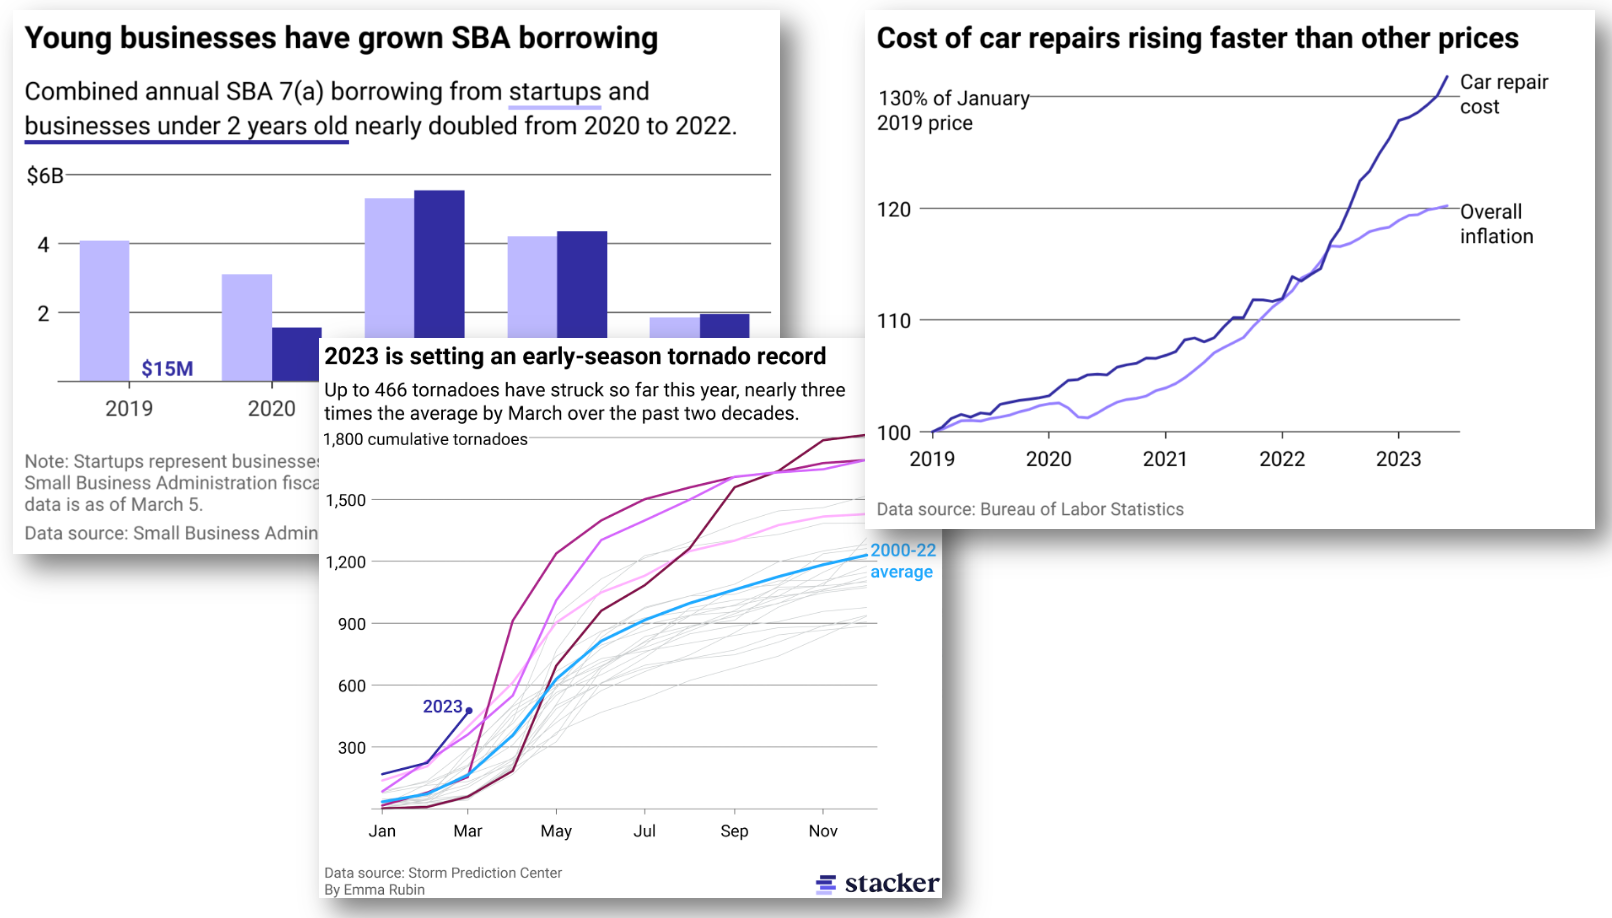
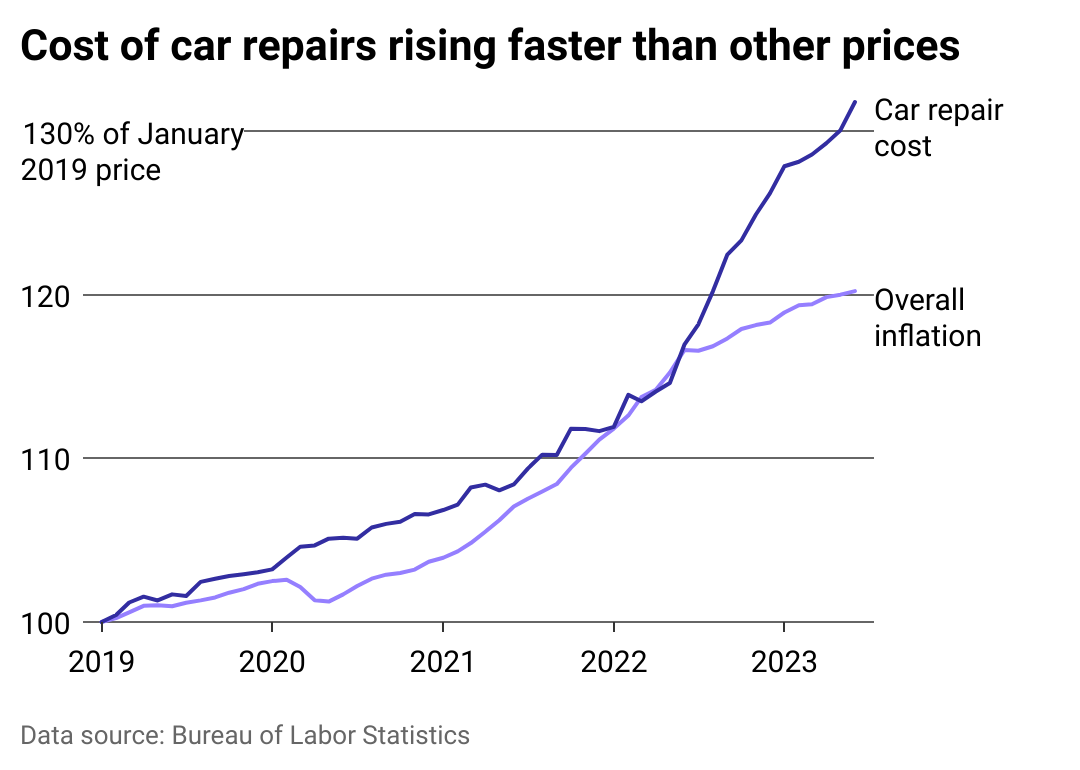
Stacker stories often use government data or other sources that use jargon or confusing language. For example, the Bureau of Labor Statistics’ Consumer Price Index, estimates inflation for different products using an index relative to a previous year. Rephrasing it as a percentage or ratio of a year’s cost rather than a raw index without units will be more intuitive for a wider audience.
A data reporter’s job is to inform readers why this data is important and relevant to their day-to-day lives. Most often, that means finding what is different and noteworthy about a dataset. For state-level data that might mean identifying the outliers and seeking out why home prices in certain metro areas are rising faster than the rest of the country.
For monthly or yearly data, pay attention to how the latest year compares to the historical range. If it was a record year for a measure, lead with that in the headline. Even if a trendline is flat, that can still be a story, especially if it contrasts with other trends and forecasts.
- Include a visual
Charts are more than just an aesthetic flare for a story, but are one of the best ways to distill data insights for readers.
Charts and maps allow us to show regional trends, changes over time, and popular categories clearly without overloading the reader with statistics and numbers. Avoiding redundant units, clashing colors, and distracting fonts will highlight what’s most important about the visualization: the patterns it’s showing.
Just as it’s important to lead the overall story with data insight, reporters should take the same approach with data visualization. Headings and subheadings should convey a takeaway that makes it easy for readers to understand what the data they’re looking at means in practice.
- Know how and when to localize
Make the data feel special and relevant to individual cities and communities.
At Stacker, our wide-reaching publishing network means we often think about ways a story can be broken down into state, metro, or county-level snapshots. But localizing data doesn’t have to require producing multiple, custom stories at once. A single story can drive local interest by highlighting the states and regions where something is most prominent like this story on tree cover loss.
Public datasets from NOAA, CDC, and Census Bureau offer countless angles at the local level, and for newsrooms with a less broad reach, they are also easy to filter down to regions of interest. Local newsrooms can also take advantage of data that is only available to their community. Many cities have open data portals where information on traffic stops, expenses, zoning, and a myriad of other sources are available. Just like national datasets, those resources are also ripe for investigation and identifying trends that can power newsy stories.